
Bridging the Divide: How L2 Networks Are Forming Clusters Ahead of Ethereum's Pectra Upgrade

As Ethereum's Pectra upgrade approaches, our latest research at Blockscout reveals that Layer 2 networks are coalescing around dominant tech stacks rather than working toward universal standards. In a recent interview with Decrypt, we shared how a shift toward technical "clustering" is happening, despite overall transaction growth in the ecosystem.
The Rise of Tech Stack Clustering
Momentum is gathering around several big players in the space, and chains are establishing interoperability within these groups but not external to them. Optimistic rollups are becoming the dominant L2 sector players led by Optimism's OP stack and followed by Arbitrum's Orbit stack according to real-time data from Rollup.wtf. Different types of zkrollups are also gaining traction, but a dominant stack has not yet emerged.
This trend points to a consolidation around L2 networks and presents an interesting challenge with "bridge abstraction" – the process of simplifying how users move assets between different chains.
Instead of contributing to a universal standard, major L2 players are developing proprietary interoperability solutions. This is causing UX friction for users, making it difficult to navigate and transfer funds between networks.
The Bridging Paradox
Our data points to an interesting paradox: while transaction volumes on L2 networks like Base have increased nearly threefold to 80 million monthly transactions, native bridging between L1 and L2 has declined by approximately 80% since early 2024.


This decline in native bridging signals that more people are using third-party solutions for faster, cheaper, and simpler bridging UX. Many of these solutions leverage recent advancements in account abstraction, intents, ZK technology, as well as native stablecoin interoperability solutions such as Circle's CCTP for USDC and LayerZero's recent USDT0 extension.
The data highlights an emerging challenge around "chain clustering," where related networks form shared standards for communicating with each other to ease interoperability. There will be chain clusters around every large ecosystem player in the future.
Interoperability of Ethereum's Layer-2 Ecosystem
At Blockscout, we have unique insights into L2 bridging, allowing us to pinpoint which bridges are performing well and where bottlenecks or security issues might arise.
Our research shows that Blockscout dominates (55+%) the Layer 2 explorer landscape, thanks to our flexibility as an open-source solution that can be self-hosted or customized to fit a wide range of L2 networks.
We index every transaction on the blockchain, including transactions to the settlement layers. While we don't analyze individual bridging protocols, we see overall trends and collect statistics for native bridges.
This includes tracking month-to-month changes in L1/L2 deposits and withdrawals by chain ID and chain type, as well as total transaction counts, verified contract counts, and user ops counts.
By looking at these statistics, we can identify which L2 stacks, ecosystems, and individual rollups are performing well.
OP Stack Dominance
According to both rollups.wtf and L2Beat, Optimism currently dominates the Layer-2 landscape. The OP stack is prevailing as the stack of choice, with Optimism consistently building infrastructure and tools for the entire Superchain family, attracting chains to join.
While many chains run as part of the Superchain ecosystem, many employ the OP stack outside of it as well. Blockscout supports most of the OP Stack-based networks both within and outside the Superchain. By looking at transaction volumes, contract deployments, and other activity, we can see the growing activity of OP Stack-based networks compared to alternative L2 solutions.
From our recent data, we've observed that Worldchain and Sonieum have been growing rapidly, while Ink and Unichain are gradually gaining momentum. Meanwhile, OP and Base have seen constant sustainable growth.
Cross-chain interoperability remains a hot topic, with OP Stack and its Superchain interoperability currently leading the way. The rapid growth of L2s is causing UX friction for users, making it difficult to navigate and transfer funds between networks.
While bridge aggregators have made significant improvements on the UI front, the ecosystem still requires a universal interoperability solution that works seamlessly across independent L2s.
L2 Growth: Real and Sustainable?
There is definitely a high churn rate in the adoption of L2 chains. Successful early adopters may fade while new chains backed by institutions and larger organizations gain traction.
Early hype doesn't always translate into sustained use. Many L2s attract a rush of early adopters – often driven by airdrops, yield farming, or one hot Dapp – only to see activity wane. Meanwhile, newer L2s backed by major players are rapidly onboarding users.
We've observed that when users migrate from a larger established platform to a new chain, it signals better future sustainability – examples include Coinbase and Base, Kraken and Inkchain, and Worldcoin and Worldchain.
Beyond Vanity Metrics: Understanding User Behavior
Beyond surface-level onchain metrics, we analyze behavioral indicators to differentiate between temporary surges and long-term adoption:
Usage Metrics
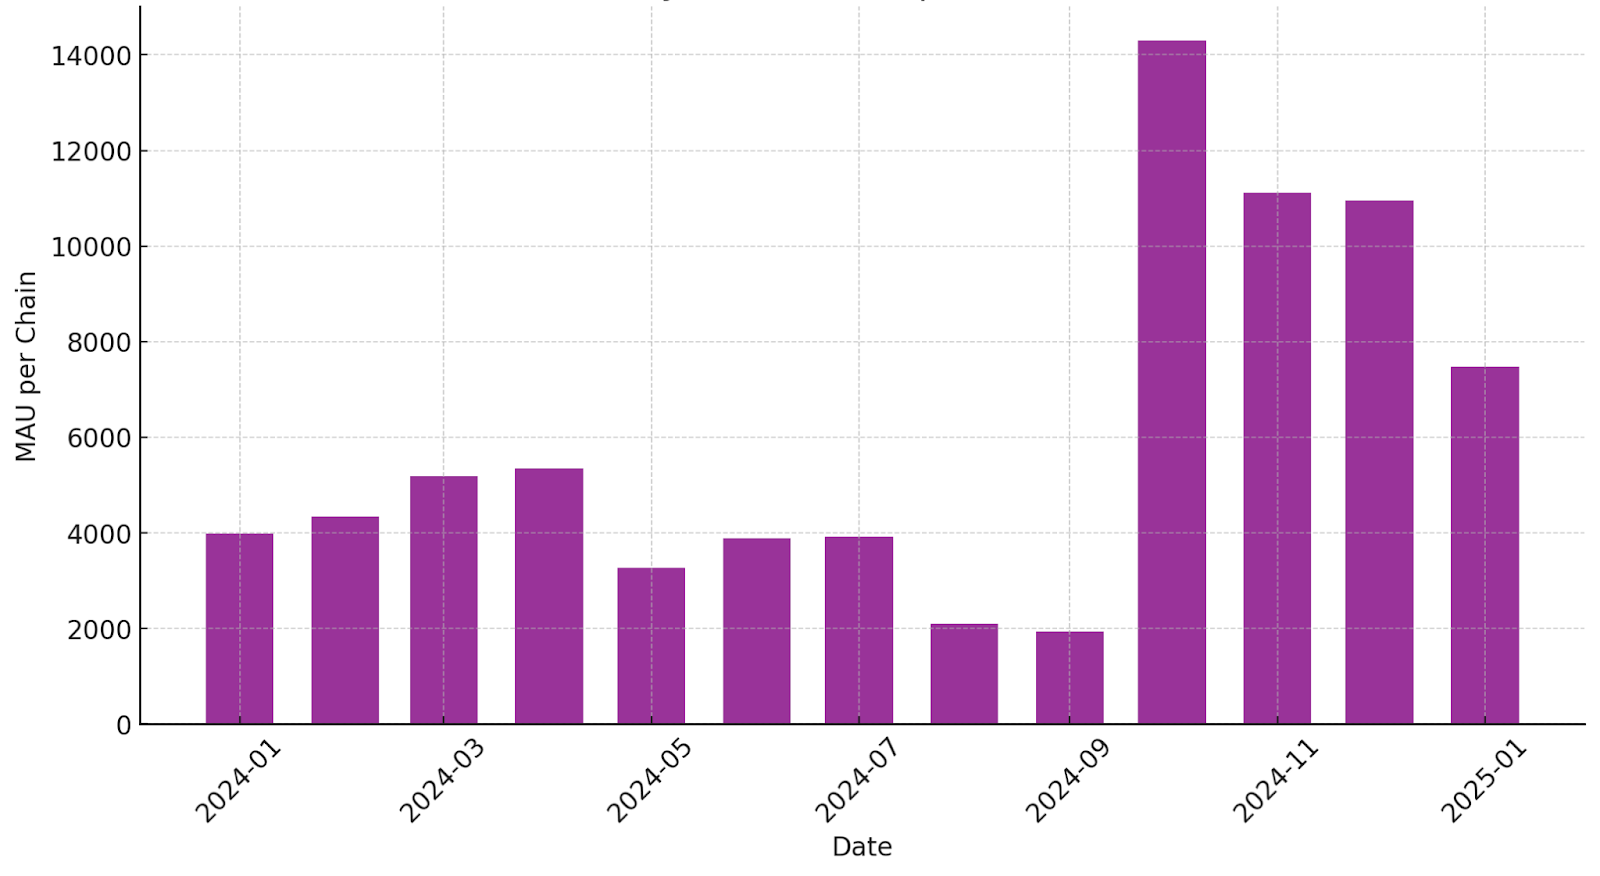
Monthly active users (MAU) per L2 chain spiked 250% in autumn 2024, reaching over 14,000 before stabilizing around 11,000. This pattern signals sustained adoption rather than temporary interest driven by airdrops or speculation.
The MAU/chain metric for all rollups – including mainnet and testnets – hosted by Blockscout shows a relatively stable growth trend in the first half of the year, followed by a dip in summer. A sharp increase in activity occurred in early fall, driven by new rollups and network activity spikes, before stabilizing at a higher level towards the end of the year. The most recent data indicates a decline, suggesting a possible stabilization after the surge in late-year activity.
Another important metric we track is Pageviews/user, which shows temporary spikes, while constant values signal sustainability.
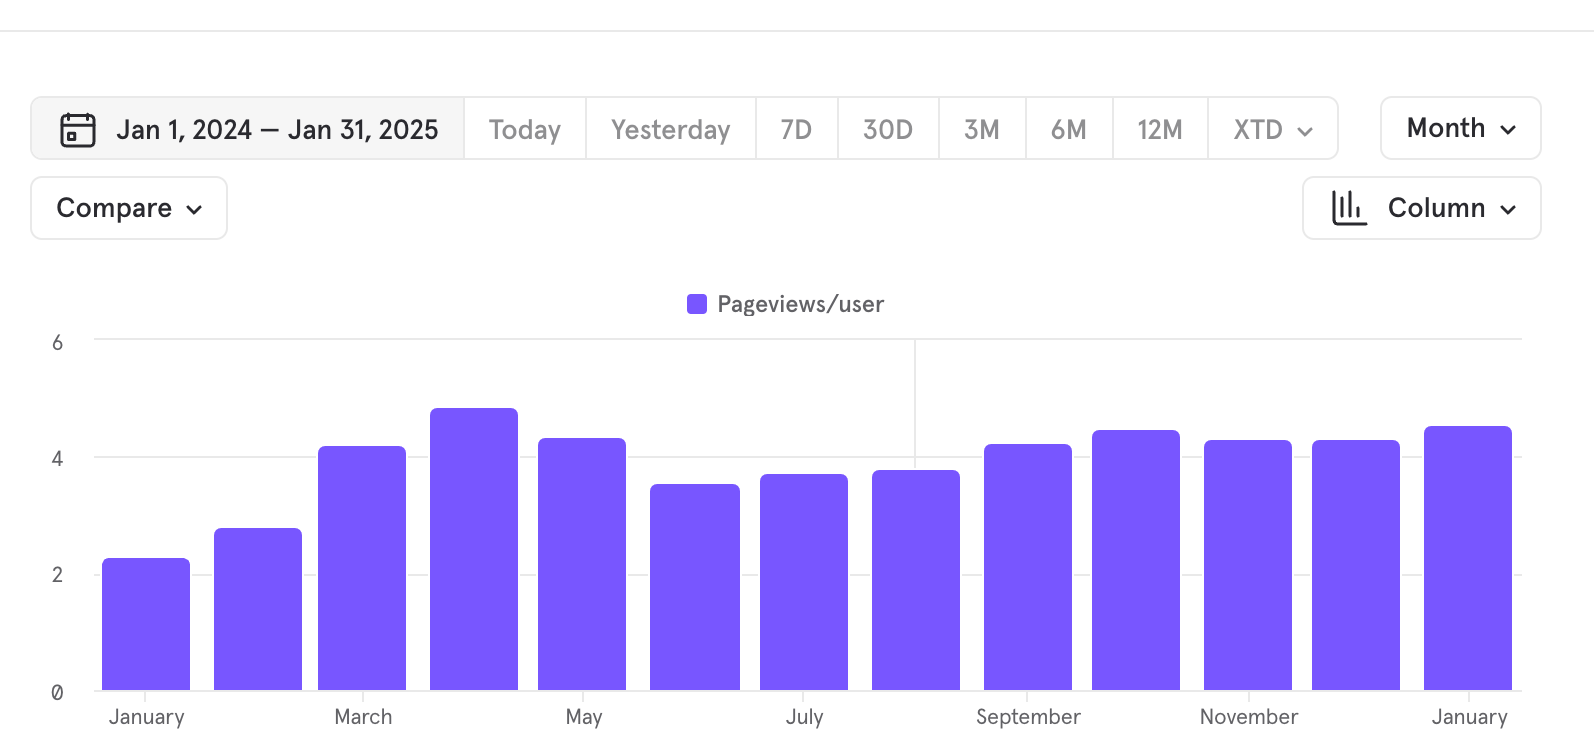
Disclaimer: While this data only shows usage across Blockscout's market share, we still use it for identifying trends using aggregated data.
Geographic Distribution
Geographic data provides valuable insights as well. While mass adoption gives fair distribution among crypto-friendly countries, surges in certain low-income countries usually indicate short-term activity associated with airdrop hunting and incentivized marketing activities on the chain.
By analyzing these indicators across multiple L2s, we can highlight whether adoption is building sustainably or if certain networks are experiencing short-lived surges due to incentives or speculative activity.
Infrastructure Load
Real sustained user activity usually correlates with increased traffic and load on Blockscout infrastructure. Some activity spikes on certain instances are short-term and require only a temporary boost in hosting resources, while others are sustained and keep the increased load over a prolonged period as users repeatedly return to the chain.
Security & Scalability Tradeoffs
While Blockscout doesn't provide direct security monitoring, we focus on transparency and better data interpretation to help users and developers detect potential risks across multiple networks.
Here's what we currently do and what we're working on to improve visibility:
- Transaction & Batch status: We provide clear insights into transaction and batch execution status, helping users understand whether transactions fail due to gas issues, contract errors, or network congestion.
- Scam token detection: While we don't classify tokens as scams, we aim to provide better metadata, such as public tags, contract verification status, and token holder distribution to help users make informed decisions --> See example
- Transaction Interpretation: We improve readability by showing brief descriptions of transactions, reducing the need to manually parse complex raw logs --> See example
- Metadata & ENS Integration: Associating addresses with ENS names, labels, and other metadata helps users quickly identify known actors and avoid interacting with suspicious wallets. We support many chain-specific or ecosystem-specific ENS alternatives and cross-chain label sharing between Blockscout instances for increased observability.
- Contract Verification: We highlight unverified contracts, making it easier to spot potentially risky or malicious deployments. Our ongoing work includes improving automated verification and surfacing more contract metadata like security scoring, audits, etc.
These improvements aim to provide better transparency, making it easier to assess risks and understand what's happening onchain.
Looking Ahead to Pectra
With Ethereum's Pectra upgrade approaching, these consolidation patterns suggest L2s are optimizing for specific capabilities that work across chains, rather than attempting to be general-purpose scaling solutions.
If this trend continues, we'll have a homogeneous interop solution that everyone will just use. As the Ethereum ecosystem prepares for Pectra, understanding these L2 consolidation trends becomes crucial for users, developers, and projects looking to navigate the evolving landscape efficiently.